
CoVaRR-Net Pillar 6 (Computational Analysis, Modelling and Evolutionary Outcomes (CAMEO))1
Executive summary: The current epidemiological, experimental, and computational evidence to date points to a clear growth advantage of the Omicron variant of SARS-CoV-2. Canada should therefore be prepared for another large pandemic wave within the next month. Even if Omicron disease severity remains the same, or even less severe than previous variants (due to viral changes and/or increased immunity), the exponential growth that is forecast will result in a large number of cases in a very short period of time, placing an extreme burden on the medical care system.
On November 26, 2021, the World Health Organization named Omicron as a variant of concern (VOC), following the alarming rise in cases reported by South Africa’s Department of Health1. Omicron has spread at faster rates than any previous VOC, with observed doubling times of 2-4 days in various jurisdictions (Ontario2: 3 days; UK3: 2-3 days; South Africa4: 3 days). Such rapid growth of a variant is unlike anything witnessed before in the pandemic, with Omicron spreading approximately three times faster than Alpha or Delta. The advantage of Omicron is thought to be due to a combination of higher transmissibility and/or a greater ability to evade immunity in individuals who were either previously infected or vaccinated4, but the relative importance of these two advantages is unknown. Early data suggest that Omicron may also be less severe5 (but see 6), although it is unknown whether this lowered severity is true in all cases, occurs only in those with prior immunity, or is an artifact (e.g., due to younger age among early infectees and the limited amount of time for the full impact of the disease to be felt).
Models can help illuminate possible futures in light of this uncertainty by exploring different values for unknown parameters and projecting case numbers and hospitalization rates. Using an epidemiological model, we track the spread of Omicron, allowing individuals to vary in vaccination status, contact rates, chance of symptomatic infection, and risk of hospitalization in an age-dependent fashion (see methods).
We begin with a set of assumptions and then describe alternative scenarios for the spread of Omicron within Canada. In the main set of models, we set the initial number of Omicron cases within the community to one in a million people on December 1. We assume that Omicron has a growth rate of r = 20% per day (doubling time of 3.5 days), which is similar to that reported previously2,3,4. We explore different assumptions about the severity of Omicron, starting with the same severity6 as earlier variants among the unvaccinated and then exploring lower levels of severity.
Preliminary estimates from the UK suggest dramatic drops in vaccine effectiveness against infection with Omicron (VEinfection), with a mean VEinfection of ~35% but with wide confidence intervals ranging from approximately 0 to 60% for individuals >15 weeks from their second of two Pfizer doses7. To account for this uncertainty, we varied VEinfection from a high of 90% to a low of 10%. Projected case numbers rise rapidly and surpass the previous maximum caseload in Canada8 of 250 cases per million (dashed line) by early January (Figure 1). Because the rate of spread is held constant (r = 20%), similar rates of rapid spread are seen in early January whether the advantage of Omicron comes largely from higher transmissibility (left panel with VEinfection = 90%) or higher immune evasion (right panel with VEinfection = 10%), although the peak is reached sooner if vaccine effectiveness remains high. A disproportionately high fraction of cases would occur among the unvaccinated if Omicron’s advantage comes primarily from higher transmissibility (left), but less so with higher immune evasion (right).
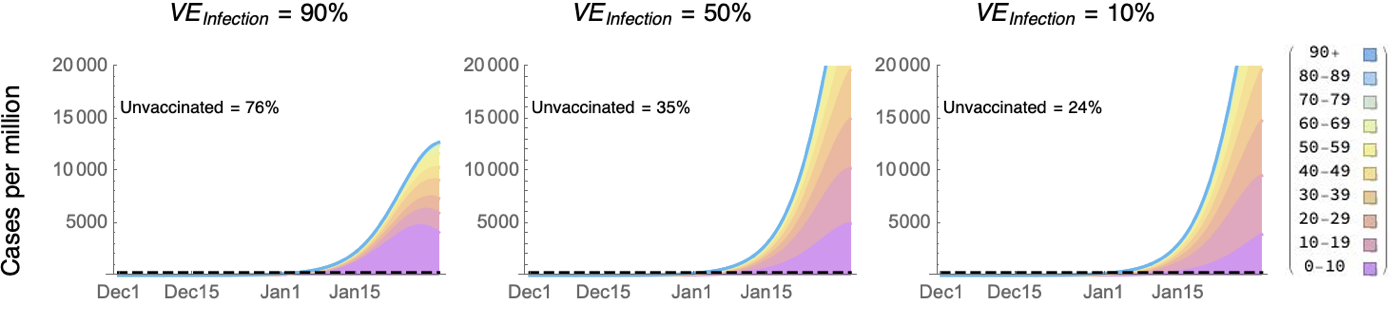
Figure 1: Projected number of Omicron cases per million Canadians given a rate of spread of 20% per day. The previous maximum is indicated by the dashed line at 250 cases per million. The projected fraction of Omicron cases among the unvaccinated individuals over this time period is noted in each panel. The colours give the number in each age class (stacked according to key on right).
Among infected individuals, we let the relative probability of a severe case be Psevere for vaccinated individuals relative to unvaccinated individuals, providing vaccine protection against severe disease of:
VEsevere = 1 – (1 – VEinfection) Psevere
“Severe” is used here to mean a case that requires hospitalization. Preliminary reports from the Tshwane district of South Africa indicate that infections with Omicron are milder, with fewer hospitalized cases requiring supplemental oxygen or ICU care5. The milder nature of these cases may, however, reflect immune protection against severe disease, as many individuals in South Africa have had prior exposure (estimated at >70%4 either vaccinated or recovered from previous infection).
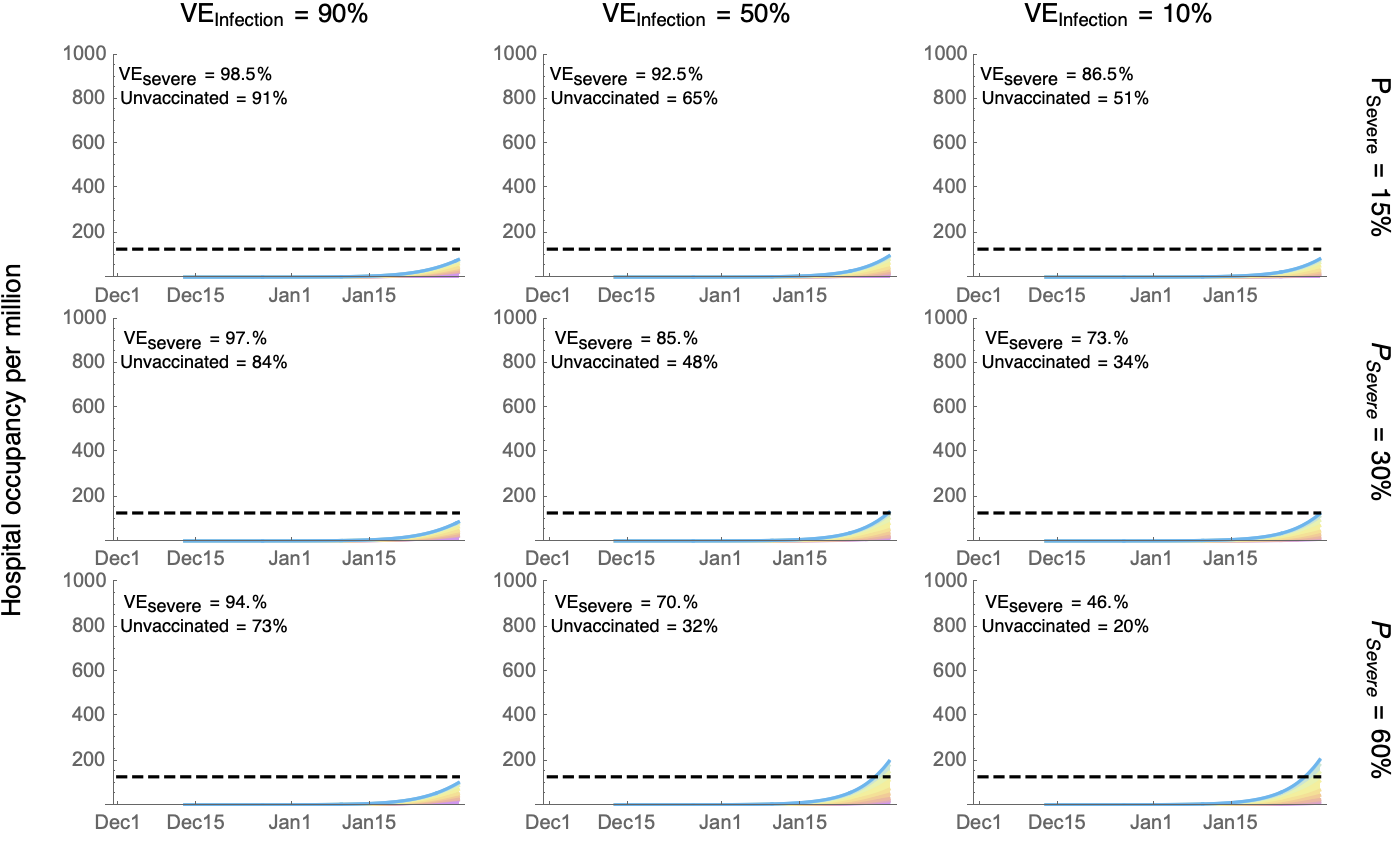
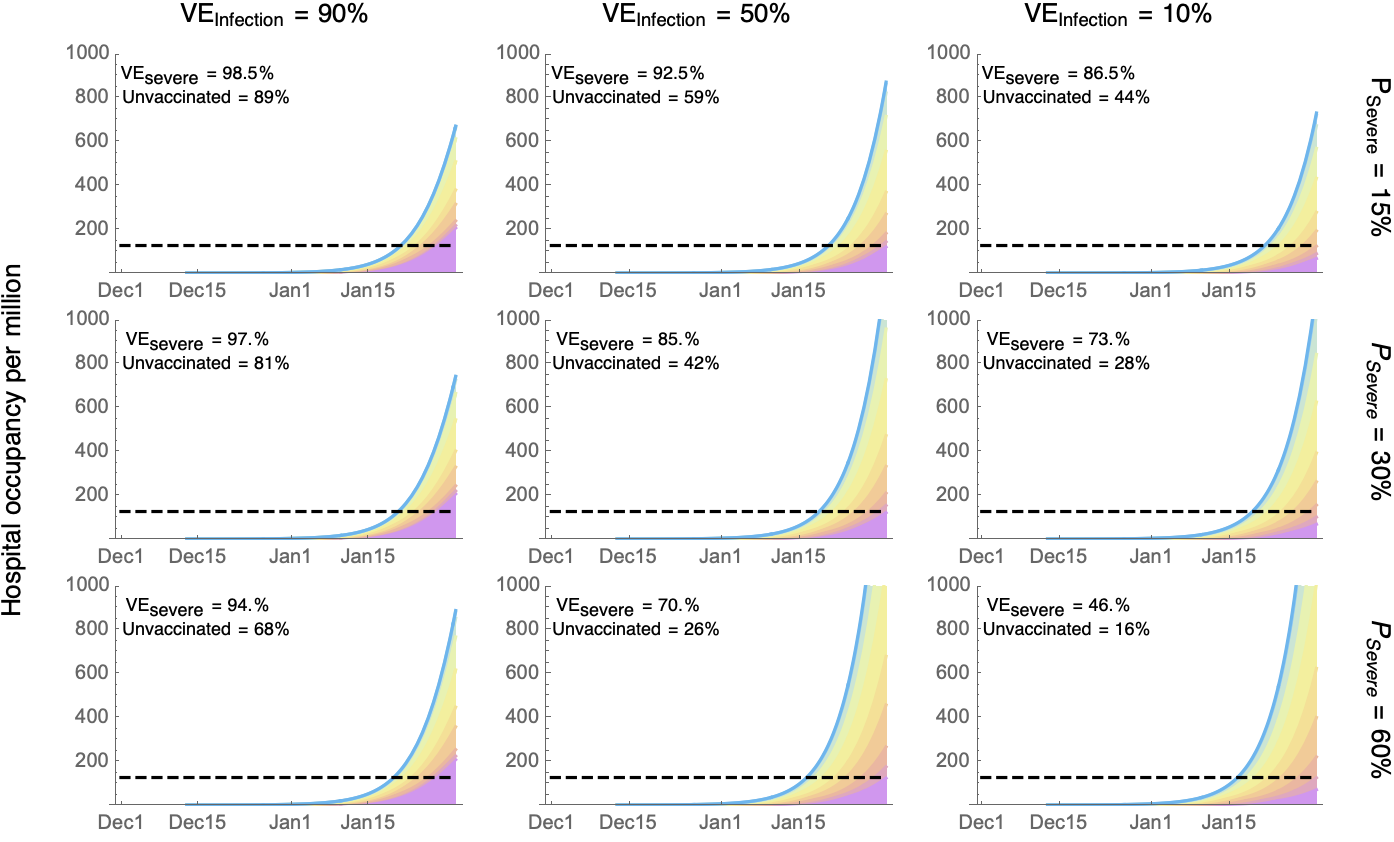
We start by projecting hospital occupancy in Figure 2 assuming that cases remain equally severe6 among individuals with no prior immunity to COVID-19 (i.e., who are unvaccinated and have not had COVID-19). Nevertheless, Omicron would still appear milder among vaccinated or previously exposed individuals (by Psevere), because they have some immune protection.
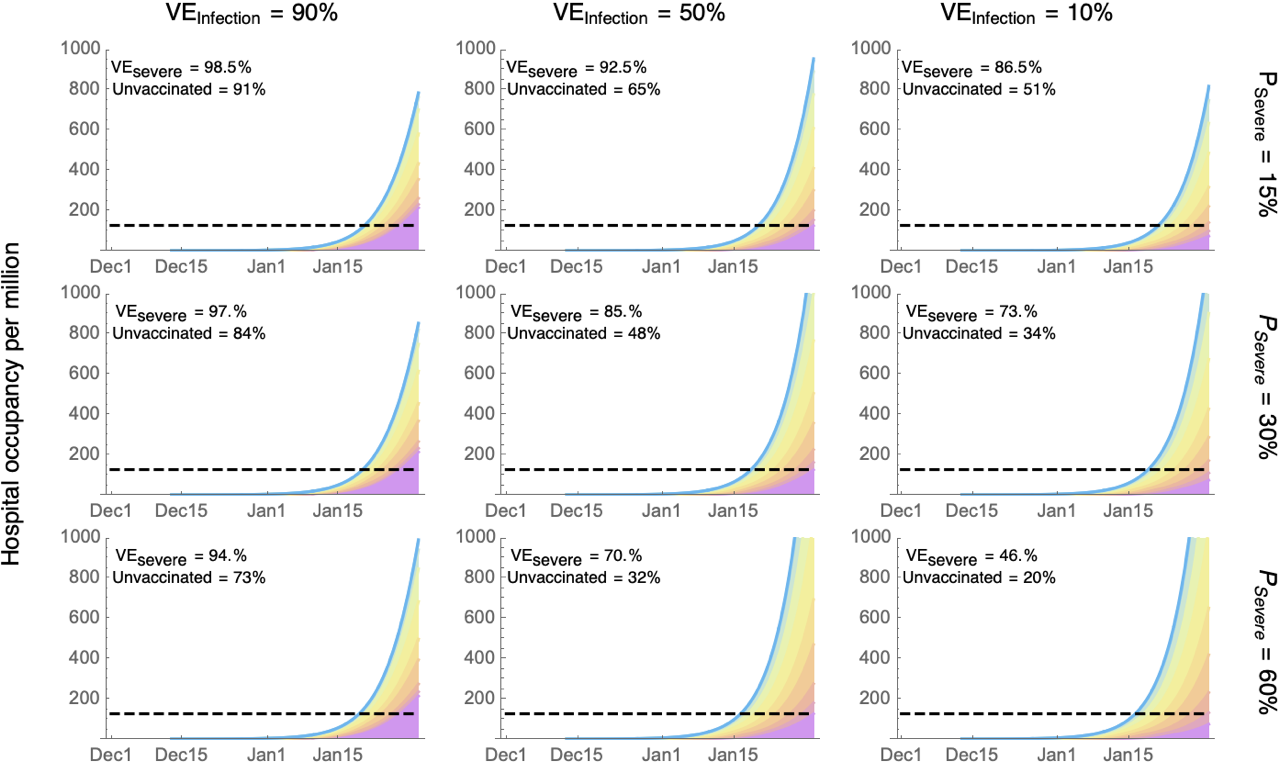
Figure 2: Projected number of Omicron cases in hospital per million Canadians given a rate of spread of 20% per day (previous maximum is indicated by the dashed line). The colours give the number in each age class (stacked according to the key in Figure 1). Comparing vaccinated to unvaccinated individuals, the columns describe different levels of protection against infection (VEinfection), the rows describe protection against severe disease among those infected (Psevere), and the inset numbers describe protection against severe disease (VEsevere), along with the projected percentage of unvaccinated individuals requiring hospitalization over this time period.
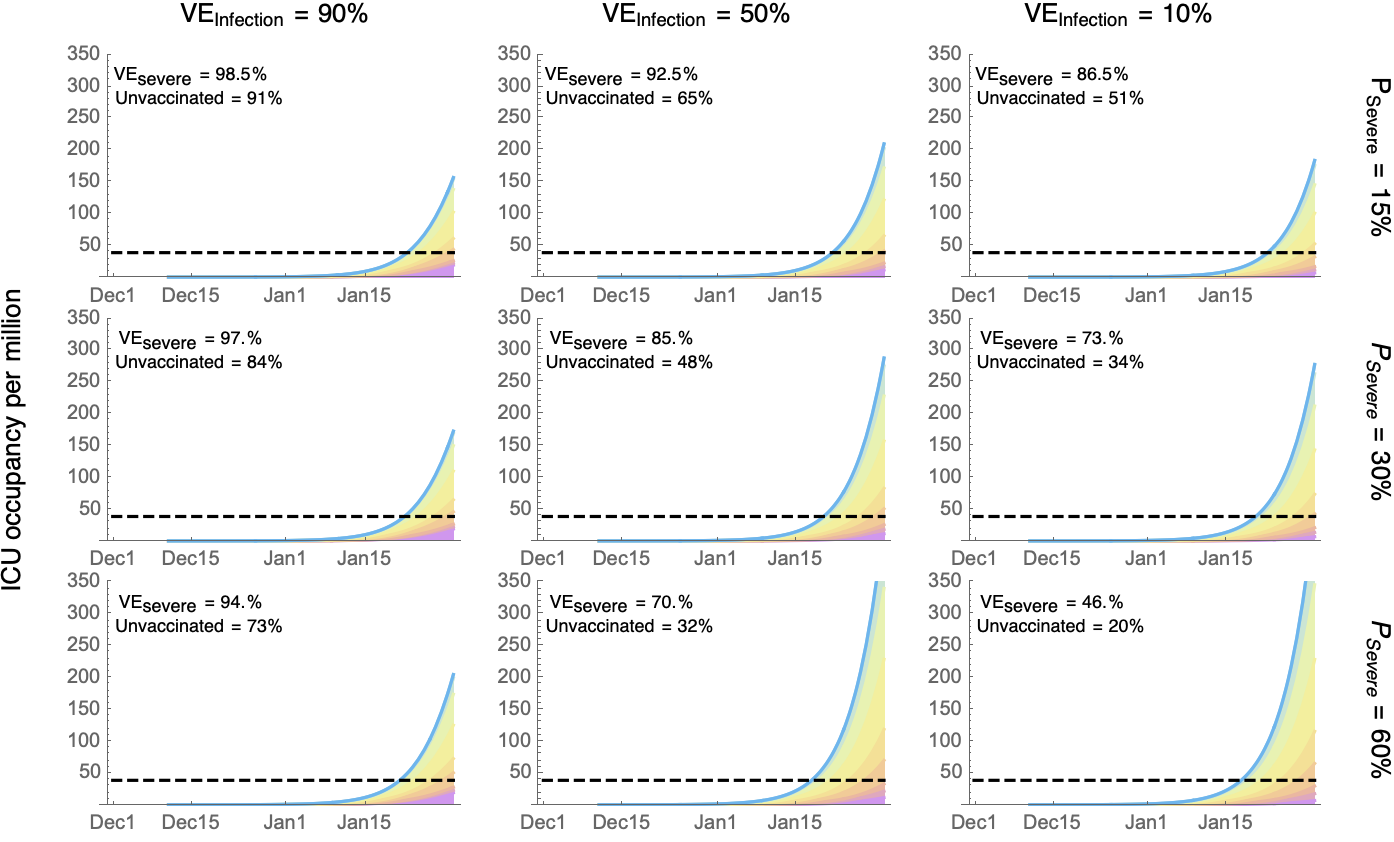
Regardless of the parameters explored, hospital occupancy is predicted to rise above the previous maximum in mid January. Similar projections are seen for ICU occupancy (alternative Figure 2a). If vaccines remain effective against infection (left panels) and/or against severe disease (upper panels), the majority of patients in hospital will be individuals who are unvaccinated or incompletely vaccinated, even though they currently comprise only 24% of the Canadian population9.
Although the severity of Omicron remains uncertain, vaccines are expected to provide substantial protection from severe disease, with little change to T-cell recognition sites10. Furthermore, preliminary data from South Africa indicates that vaccinated individuals retain moderate protection against hospitalization, with VEsevere = 70%11 (as in the middle right and bottom centre panels of Figure 2).
We briefly consider alternative scenarios to those considered above:
- If Omicron establishes within a region earlier or later, then the dates in the above figures shift by that amount (we assumed 1 case per million in the community on December 1).
- If Omicron is less severe, with a smaller proportion x of all cases requiring hospitalization (both vaccinated and unvaccinated), then the scale on the hospital occupancy graph is multiplied by x.
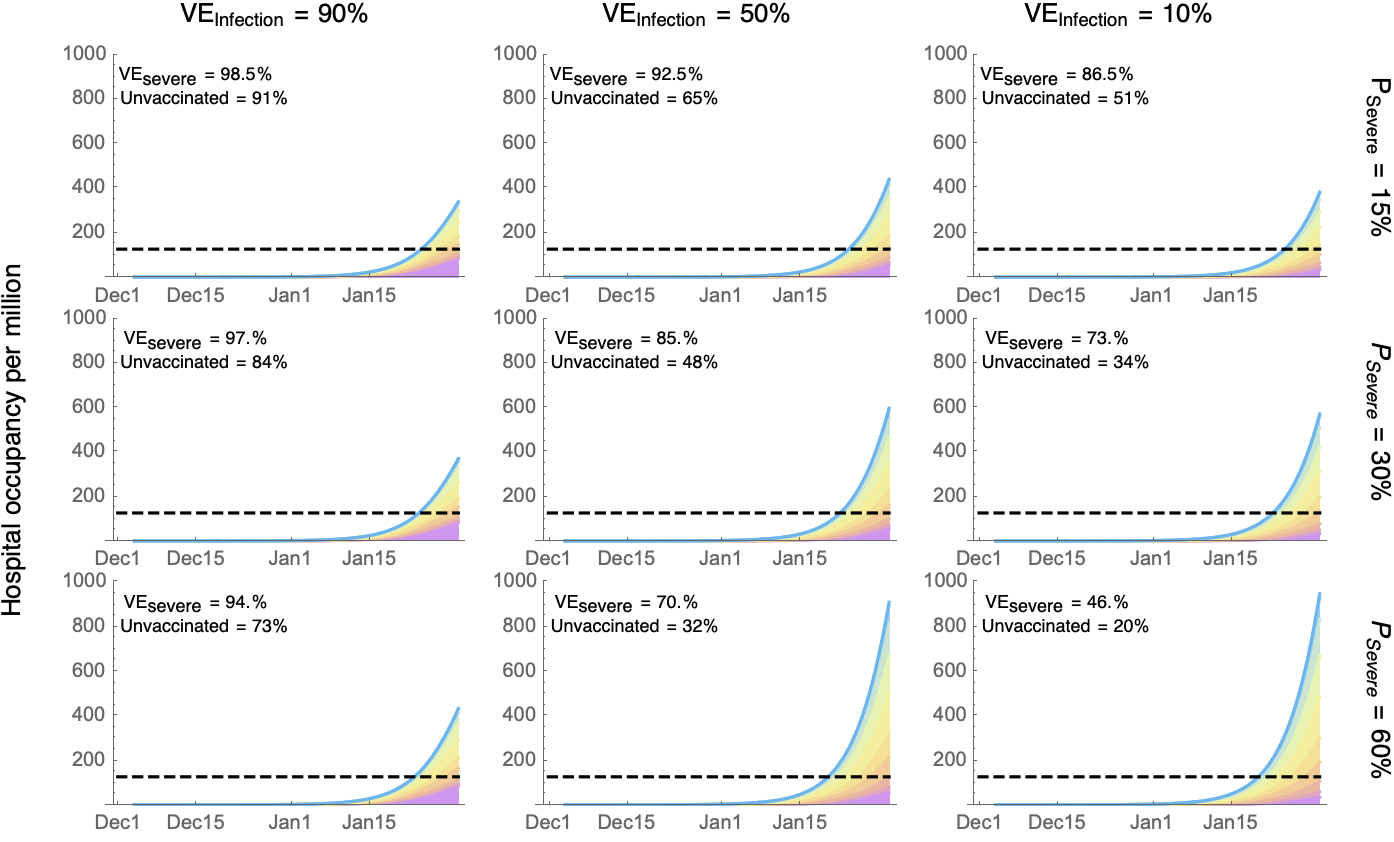
- Alternative Figure 2b assumes all cases are half as severe, but even then hospital and ICU occupancy rises beyond the maximum yet seen in the pandemic a few days later than observed in Figure 2.
- Alternative Figure 2c assumes all cases are 1/10th as severe, which keeps hospital occupancy below the maximum throughout January, although this extreme reduction in severity is not consistent with early data analyses6,11.
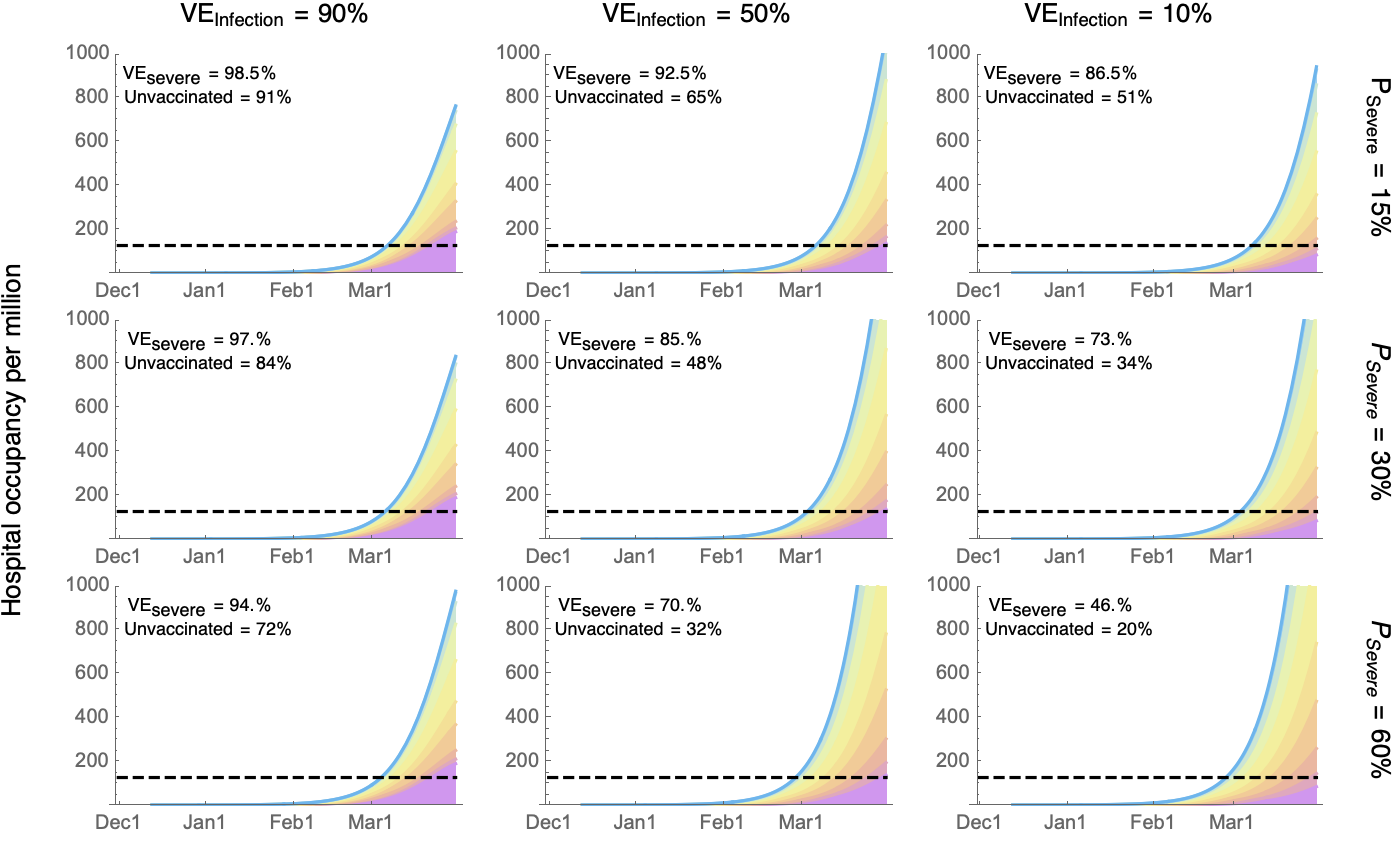
- If the growth rate of Omicron were to be slowed down to 10% per day (doubling time of 6.9 days), then roughly speaking, the two-month scale stretches to a four-month scale (e.g., alternative Figure 2d with r = 0.1). Beyond slowing the Omicron wave, the peak height and total number of Omicron cases are diminished by slowing the growth rate (see alternative Figure 2e).
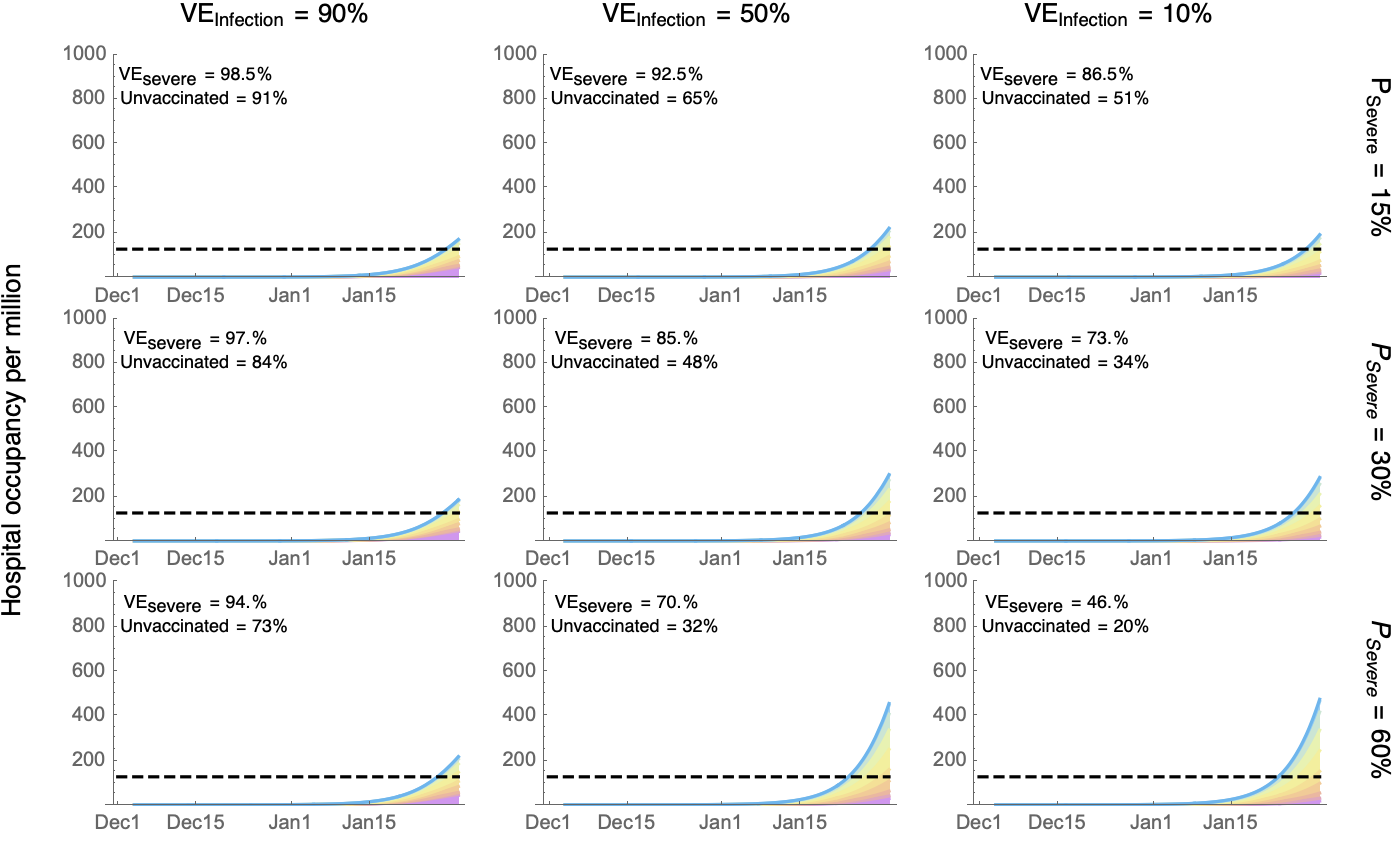
- If Omicron grows at a faster rate in Canada of 30% per day (doubling time of 2.3 days, similar to the UK), however, then the two-month scale shrinks to a five-week time scale.
Conclusions
If Omicron spreads uncontrolled in Canada at a similar pace as seen previously2,3,4 and if the severity of cases among the unvaccinated remains the same, the number of hospitalized COVID-19 cases is predicted to reach the maximum experienced to date in the pandemic in mid January. Even if Omicron were half as severe in unvaccinated individuals, this maximum would be reached just a few days later (alternative Figure 2b). Only if there were an extreme reduction in severity among Omicron cases (about ten-fold; alternative Figure 2c) or a combination of reduced severity and shorter hospital stays (alternative Figure 2f) would the peak hospital occupancy remain lower than the previous maximum.
To avoid an overburdened medical system, efforts are needed to reduce Omicron transmission. There are many measures that individuals and public health officials can take to reduce the peak burden of Omicron (Figure 3). Possible means to substantially reduce the burden of Omicron on the medical care system include:
- Rapidly rolling out booster shots: To the extent that the advantage of Omicron comes from evading immunity, then rolling out booster shots as rapidly as possible would slow the rate of spread of Omicron substantially. For example, if VEinfection drops to 35% after the standard two doses but rises to 75% after a booster, consistent with preliminary data with the Pfizer vaccine from the UK7, then the 20% daily growth rate of Omicron could be slowed to 10.5% (a 6.6 day doubling), reducing the peak hospital demand in January dramatically (160 fold). Boosters are needed as soon as possible (within days not weeks), however, to allow time for neutralizing antibodies to rebuild and prevent a January spike in hospital demand.
- Targeting boosters to the most vulnerable: If boosters are obtained soon by those 60+ in age, the rapid spike in cases remains (15.3% growth rate), but peak hospital demand in January drops substantially (17 fold).
- Expanding non-pharmaceutical interventions (NPIs): Improving mask quality, improving ventilation, restricting gathering sizes, and testing more broadly, including with rapid antigen tests, to detect and isolate cases could further slow Omicron spread. Several NPIs have been shown to reduce the spread of COVID-19 (e.g. reducing Rt by 0.0-0.4 per intervention12). In British Columbia, broad restrictions on social gatherings and restaurant closures have reduced growth rates by ~5-6%. Such measures have the added benefit of buying more time for vaccination.
- Rapidly rolling out shots among children: With early data from South Africa indicating that children are hospitalized 20% more often from Omicron than previous variants, vaccinating children helps protect them against severe disease. The effect on the spread of Omicron is modest, however, as long as Omicron’s advantage comes from evading immunity. For example, if the fraction of children under ten who are vaccinated is raised rapidly from ~4% to 50%, the daily growth rate of Omicron declines only slightly from 20% to 19.3% with VEinfection = 50%, because this age class is a relatively small fraction of cases in which Omicron evades immunity.
- Travel restrictions: Restricting travel into Canada would not make a difference13 because of the high prevalence of Omicron already observed in several parts of the country2. Point-of-arrival testing and recommendations for travellers to test, even within Canada, would help slow the spread of Omicron. Travel measures that delay establishment by different amounts in different communities could stagger peak hospital demand over time, allowing the burden on the medical care system to be shared across regions.
This report explores the potential trajectory of Omicron and its impact on hospital demand in light of the major sources of uncertainty that remain. Booster shots are found to be a key mechanism to raising the “wall of immunity” against Omicron. Rebuilding this wall will be most important if vaccine effectiveness against infection by Omicron has waned as much as seen in the UK7. As more information comes to light, projections will be revised to help guide us through the Omicron wave.
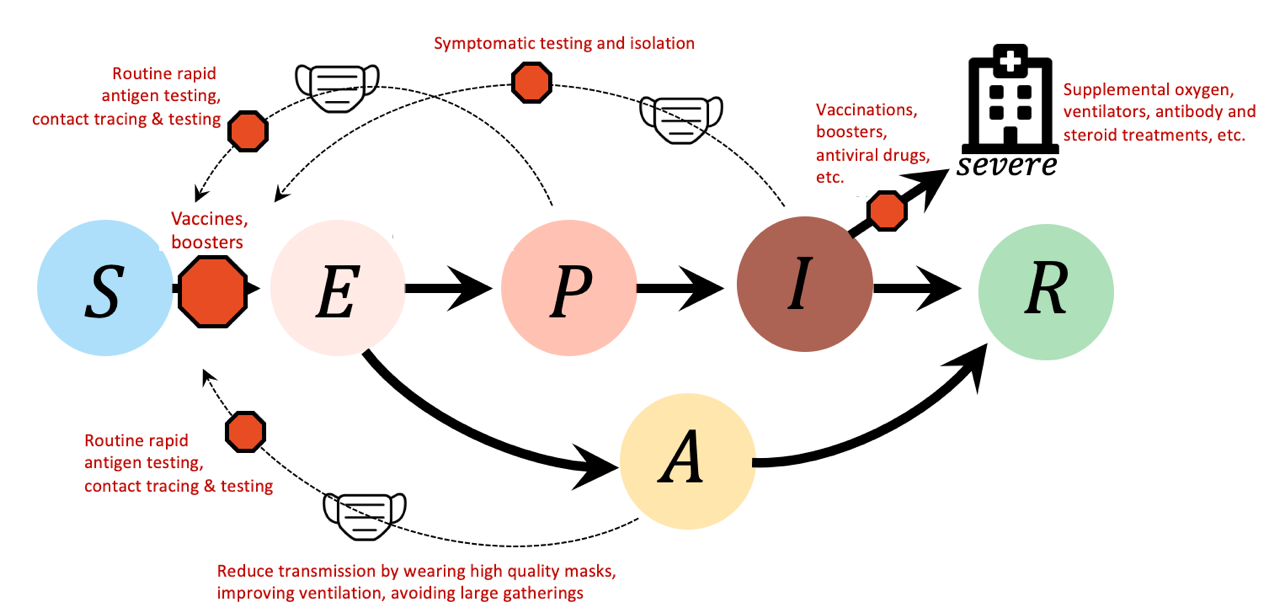
Figure 3: Measures to help Canada through the Omicron wave. Different measures are shown in red text and ‘stop signs’ to indicate where they can break epidemic links. Vaccines and boosters reduce infections of susceptible individuals (S) and reduce the severity of the disease among infected individuals (I). Improving mask quality, improving ventilation, restricting gathering sizes, and testing more broadly (including with rapid antigen tests) to detect and isolate cases reduce the risk of transmission from infectious individuals (P: presymptomatic, I: symptomatic infections, A: asymptomatic). The stronger the combination of individual and public health measures the lower the Omicron health burden is predicted to be.
Methods:
To model the dynamics of SARS-CoV-2, we use the SEAPIR model of Day et al. (2021)14, which allows for susceptible individuals (S), exposed but not infectious (E), asymptomatic (A), pre-symptomatic (P), symptomatic (I), and recovered individuals (R) (Figure 4). Asymptomatic, pre-symptomatic, and symptomatic individuals are all infectious but may differ in infectiousness (Table 1). Each host class is structured into 10 age classes (0-9, 10-19,…90+) and two immune classes, naive and primed. Naive individuals have never had COVID-19 and are not fully vaccinated, and immunologically primed individuals have either been fully vaccinated or had COVID-19 (very similar results are observed if partially vaccinated individuals are also included in the immunologically primed set, alternative Figure 2g). Age is allowed to influence the severity of cases and the chance that an infected individual remains asymptomatic (f), with youth generally having milder symptoms. The model also allows transmission rates to be lower among asymptomatic cases (by a factor g).
The fraction of individuals of each age class, hospitalization rates by age, and vaccination status by age were obtained using data from British Columbia9,15, as a reference population (note that this is similar to other regions across Canada). Contact rates were modeled as in Mulberry et al. (2021)16, which is characterized by higher contact rates among younger individuals. The average length of stay in hospital was set to 12 days; ICU stay was set to 10 days17. Additional parameter values for the model illustrated in Figure 4 are given in Table 1.
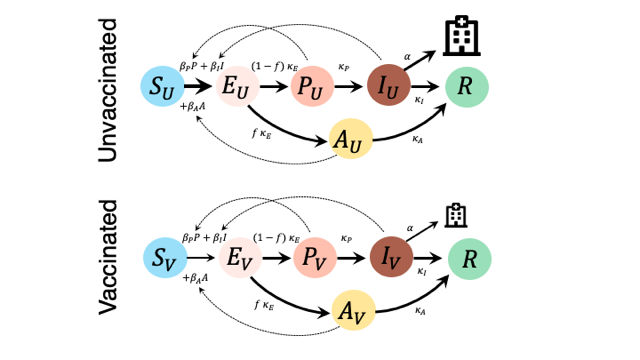
Figure 4: SEAPIR model for SARS-CoV-2 from Day et al. (2020), accounting for different rates of infection and disease severity among the unvaccinated (top) and vaccinated (bottom). Individuals are assigned to an immune and age class (0-9, 10-19,…,90+), according to vaccination status recorded in Canada on 4 December 20219. All individuals are assumed to be initially susceptible to Omicron, but vaccinated individuals are protected from infection by a VEinfection and from severe disease by VEsevere. Susceptible individuals (S), once infected, become exposed (E: not infectious) until the virus load rises high enough to become infectious (P: presymptomatic, I: symptomatic infections, A: asymptomatic). Individuals who have built immunity against Omicron enter the resistant class (R).
Table 1: Model parameters
| Parameter | Meaning |
| κE = 1/3.1 | Rate of exiting exposed class (mean = 3.1 days) |
| κP = 1/2.3 | Rate of exiting presymptomatic class (mean = 2.3 days) |
| κA = 1/7.6 | Rate of exiting asymptomatic class (mean = 7.6 days) |
| κI = 1/4.7 | Rate of exiting symptomatic infectious class (mean = 4.7 days) |
| βP = βI = β | Infectiousness of presymptomatic and symptomatic infectious individuals. is adjusted to match the daily growth rate of Omicron. |
| βA = g β = 0.2 β | Asymptomatic individuals are assumed to be 20% as infectious as presymptomatic and symptomatic cases. |
| f = 0.4 (youth) = 0.2 (adults) |
The fraction of cases that are asymptomatic is set to 40% for youth (0-19) and 20% for adults. |
| mj,k | Contact rate between an individual of age class j and k (see 11) |
| VEinfection | Proportionate reduction in infection among vaccinated individuals |
| VEsevere | Proportionate reduction in severe infection among vaccinated individuals |
| Psevere | The relative probability that an infection results in a severe case requiring hospitalization for vaccinated compared to unvaccinated individuals. |
References:
- Pearson et al. (3 December 2021) Omicron spread in South Africa: Growth, transmissibility, & immune escape estimates https://drive.google.com/file/d/1hA6Mec2Gq3LGqTEOj35RqSeAb_SmXpbI/view
- Ontario Science Table dashboard (12 December 2021) https://covid19-sciencetable.ca/ontario-dashboard/
- BBC news (8 December 2021) “Covid: Early signs Omicron spreads more easily, says No 10” https://www.bbc.com/news/uk-59563939
- Scientific Advisory Group for Emergencies UK (7 December 2021) “SPI-M-O: Consensus Statement on COVID-19” https://www.gov.uk/government/publications/spi-m-o-consensus-statement-on-covid-19-7-december-2021/spi-m-o-consensus-statement-on-covid-19-7-december-2021
- South African Medical Research Council (4 December 2021) https://www.samrc.ac.za/news/tshwane-district-omicron-variant-patient-profile-early-features
- Ferguson et al. (2021) Report 49 – Growth, population distribution and immune escape of Omicron in England https://www.imperial.ac.uk/mrc-global-infectious-disease-analysis/covid-19/report-49-omicron/
- Andrews et al. (2021) Effectiveness of COVID-19 vaccines against the Omicron (B.1.1.529) variant of concern. https://www.medrxiv.org/content/10.1101/2021.12.14.21267615v1.full.pdf
- Health Infobase Canada (accessed 12 December 2021) COVID-19 daily epidemiology update. https://health-infobase.canada.ca/covid-19/epidemiological-summary-covid-19-cases.html
- Public Health Agency of Canada. (10 December, 2021) Canadian COVID-19 vaccination coverage report. Ottawa: Public Health Agency of Canada (vaccination status up to 4 December, 2021). https://health-infobase.canada.ca/covid-19/vaccination-coverage/
- Sette (2021) “Further studies on SARS-CoV-2 variants” (WHO presentation) https://www.who.int/news-room/events/detail/2021/12/15/default-calendar/who-global-consultation—what-evidence-do-we-have-that-omicron-is-evading-immunity-and-what-are-the-implications
- Discovery Health (2021) Real-world analysis of Omicron outbreak based on 211,000 COVID-19 test results in South Africa”. https://www.discovery.co.za/corporate/news-room#/documents/press-release-dot-pdf-417948
- Haug et al. (2020) Ranking the effectiveness of worldwide COVID-19 government interventions. Nature Human Behaviour 4: 1303–1312 https://www.nature.com/articles/s41562-020-01009-0.pdf
- Hurford et al. (2021) Travel restrictions and the Omicron variant (CANmod report). https://canmod.net/public-health
- Day et al. (2020). On the evolutionary epidemiology of SARS-CoV-2. Current Biology, 30(15), R849-R857
- British Columbia Centre for Disease Control (9 December, 2021) Situational Report. http://www.bccdc.ca/Health-Info-Site/Documents/COVID_sitrep/Week_47_2021_BC_COVID-19_Situation_Report.pdf
- Mulberry et al. (2021). Vaccine rollout strategies: The case for vaccinating essential workers early. PLOS Global Public Health, 1(10), e0000020.
- Canadian Institute for Health Information (12 December 2021) COVID-19 hospitalization and emergency department statistics. https://www.cihi.ca/en/covid-19-hospitalization-and-emergency-department-statistics
1Contributing authors: Sarah Otto*, Fiona Brinkman, Caroline Colijn, Anne-Claude Gingras, Paul Gordon, Jeff Joy, Susanne Kraemer, Carmen Lía Murall, and B. Jesse Shapiro. *Correspondence: otto@zoology.ubc.ca